A trading platform is where everything comes together — from placing orders to analyzing charts. It's the main tool traders rely on to interact with the markets. Getting familiar with how a platform works is key to managing trades effectively, spotting opportunities, and staying organized during fast-moving conditions.
This guide breaks down the essentials. You'll learn how to navigate core features like order windows, charting tools, and workspace customization, so you can trade with precision and focus.
What Is a Trading Platform?
A trading platform is a digital interface that connects traders to the financial markets. It serves as the main tool for analyzing price data, placing trades, and managing positions in real time. Without a trading platform, accessing markets like forex, commodities, or indices would be impossible for retail traders.
There are different types of platforms available based on how you prefer to trade:
- Desktop platforms: offer full functionality and are ideal for serious traders who value speed, performance, and advanced tools.
- Web-based platforms: run directly in a browser and are perfect for flexibility and accessibility from any device with internet access.
- Mobile platforms: are designed for on-the-go trading, giving users control over their positions from smartphones or tablets.
Some of the most widely used trading platforms include MetaTrader 4 (MT4), cTrader (MT5), and broker-specific proprietary platforms. These systems vary in design and features, but all aim to provide a seamless trading experience tailored to different user preferences and needs.
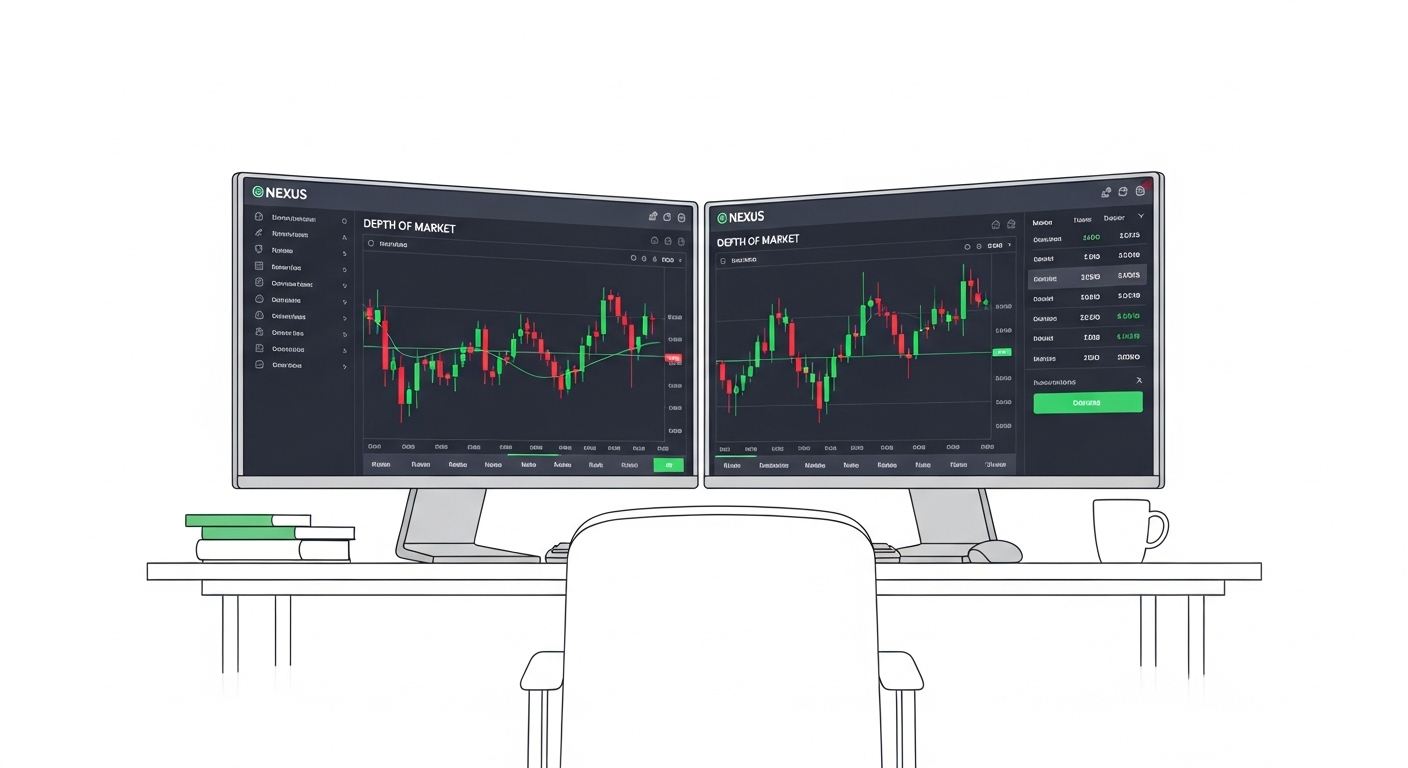
Platform Interface Overview
Understanding the layout of a trading platform is key to operating efficiently. Most platforms follow a similar structure, with clearly divided areas for core functions. Once familiar with the interface, you’ll be able to respond quickly to market movements and execute trades without hesitation.
The typical interface includes:
- Price charts that display real-time movements of selected instruments.
- Order panels where traders can set position size, stop-loss, and take-profit levels.
- Asset lists or market watch windows to browse available instruments.
- News feeds or economic calendars to stay updated with impactful events.
Navigation usually starts with a dashboard that provides a snapshot of account activity, recent trades, and available tools. Menus and sidebars offer quick access to indicators, settings, and historical data. Many platforms also allow you to detach or rearrange panels, helping you create a personalized workspace that matches your trading style.
Placing and Managing Orders
Order execution is one of the most important aspects of using a trading platform. Knowing how and when to place different types of orders allows you to react to market conditions with precision and control your risk more effectively.
There are several types of orders you can use:
- Market orders: execute instantly at the current market price.
- Limit orders: allow you to buy or sell at a specific price or better.
- Stop orders: become market orders once a certain price is reached, commonly used for stop-loss or breakout entries.
Most platforms also let you modify or cancel your orders directly from the chart or the order window. This includes adjusting stop-loss and take-profit levels or changing position size before execution.
Some platforms support one-click trading, which lets you open or close trades immediately without confirmation prompts. This feature is ideal for active traders but should be used carefully due to its speed and potential for error if misclicked.
Charting and Technical Analysis Tools
Charts are at the core of every trading decision. They visually represent price movements over time and help traders identify patterns, trends, and potential entry or exit points.
Most platforms offer multiple chart types, including:
- Candlestick charts, which show open, high, low, and close prices for a specific time frame.
- Line charts, which connect closing prices over time and are useful for spotting general trends.
- Bar charts, which provide similar information to candlesticks but in a different format.
Technical indicators can be added to charts to provide insights into market behavior. Common tools include Moving Averages, RSI (Relative Strength Index), MACD (Moving Average Convergence Divergence), and Bollinger Bands. These indicators help traders measure momentum, volatility, and trend strength.
In addition to indicators, platforms provide drawing tools for marking up charts. You can sketch trendlines, highlight support and resistance levels, and map out chart patterns like head and shoulders or triangles. These tools are essential for building a trading strategy based on visual analysis.
Conclusion
Mastering a trading platform takes more than just knowing where to click — it requires confidence in using each tool to support your trading goals. From understanding order types to analyzing charts and customizing your interface, the right knowledge gives you the control to act fast and think clearly in any market condition.
As you grow more familiar with your platform, it becomes more than just software — it becomes part of how you trade. Explore every feature, test strategies, and keep learning. The better you know your platform, the better you position yourself for smarter, more informed decisions.